INFOGRAPHICS: March 2023 CREB City And Region Market Reports
Posted by admin on
Prices rise as conditions favour the seller
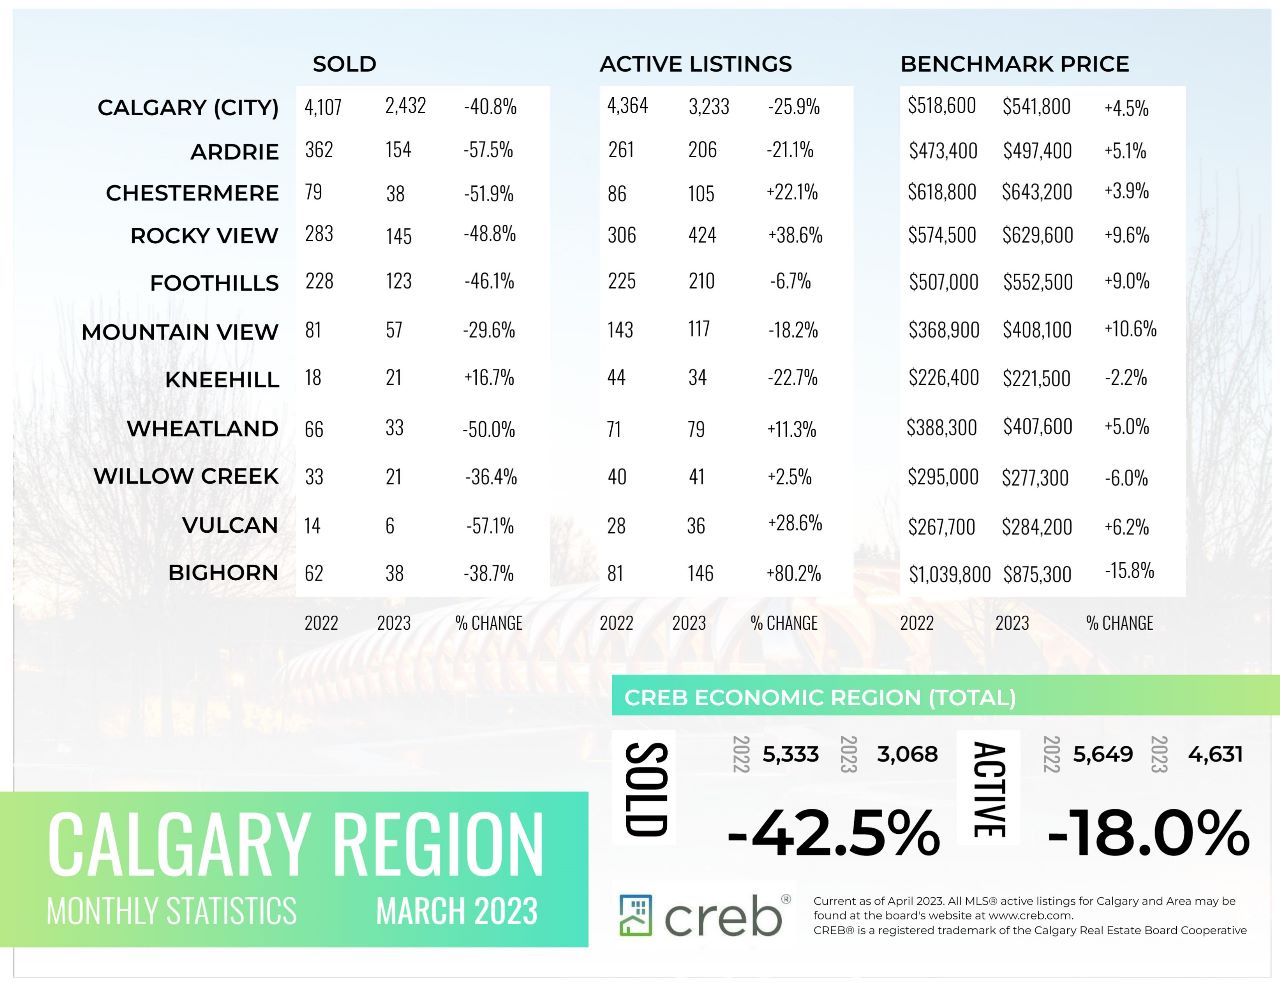
Sales and new listings have improved over the levels reported at the beginning of the year. As a result, the spread between sales and new listings supported some expected monthly inventory level gains. However, the 3,233 available units reflected the lowest March inventory levels since 2006 and left the months of supply just above one month, firmly in the seller’s territory. While conditions are not as tight as last March, low inventory levels leave purchasers with limited choice, once again driving up home prices.
Total unadjusted residential home prices reached $541,800 in March, a two per cent gain over last month and nearly one per cent higher than prices reported last year. While prices remain below the May 2022 high of $546,000, the pace of price growth over the first quarter has been stronger than expected due to the persistent seller’s market conditions. “As expected, sales have eased from record levels while remaining stronger than they were before the pandemic thanks to recent gains in migration supporting demand,” said CREB® Chief Economist Ann-Marie Lurie.
“The challenge has been centered around supply. As a result, existing homeowners may be reluctant to list as they struggle to find an acceptable housing alternative in this market. At the same time, higher lending rates can also reduce the incentives for existing homeowners to list their home.”
Read the full report on the CREB website!
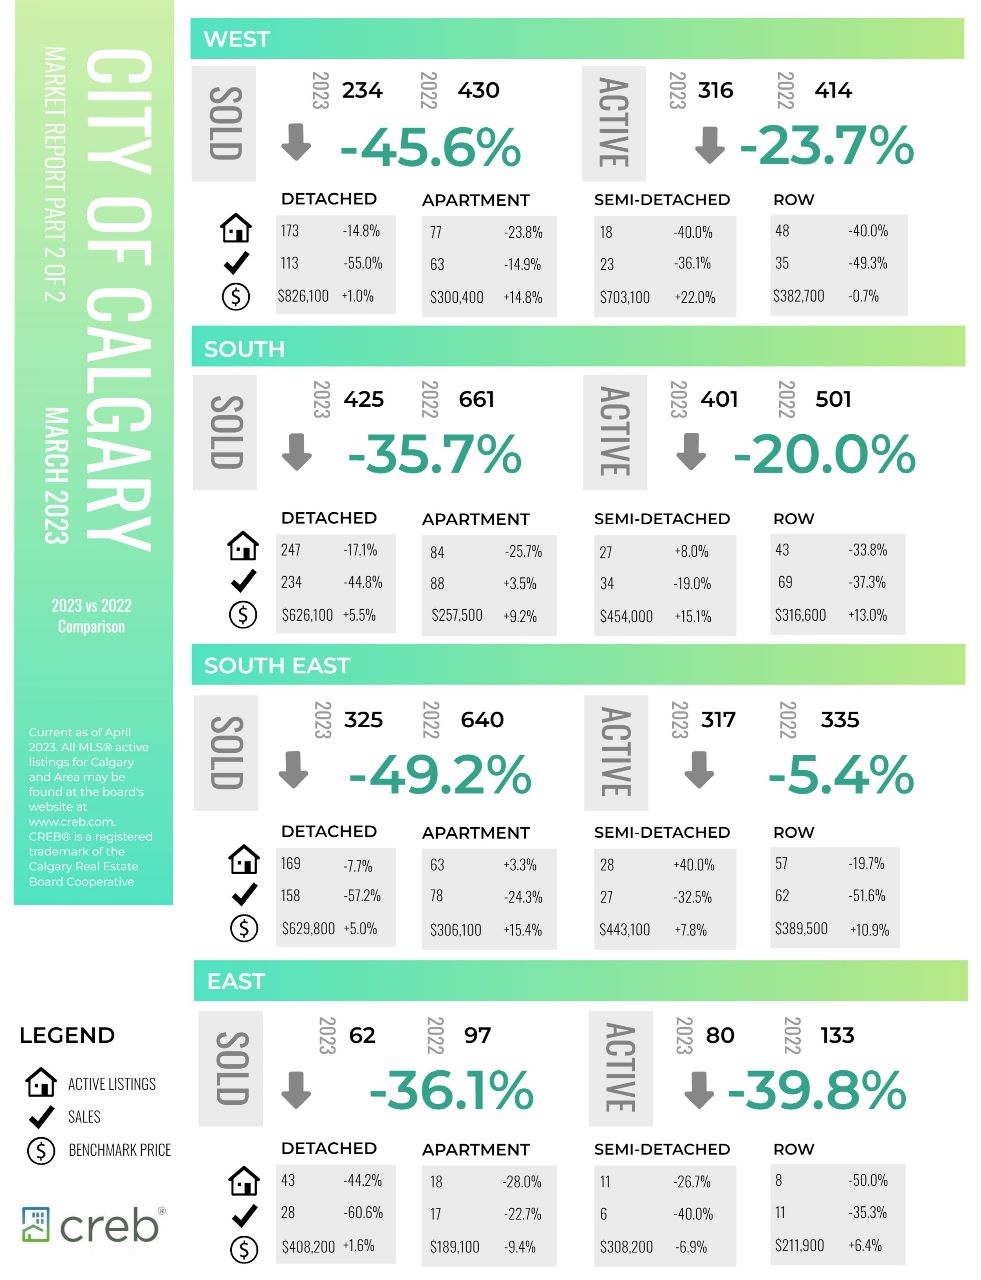
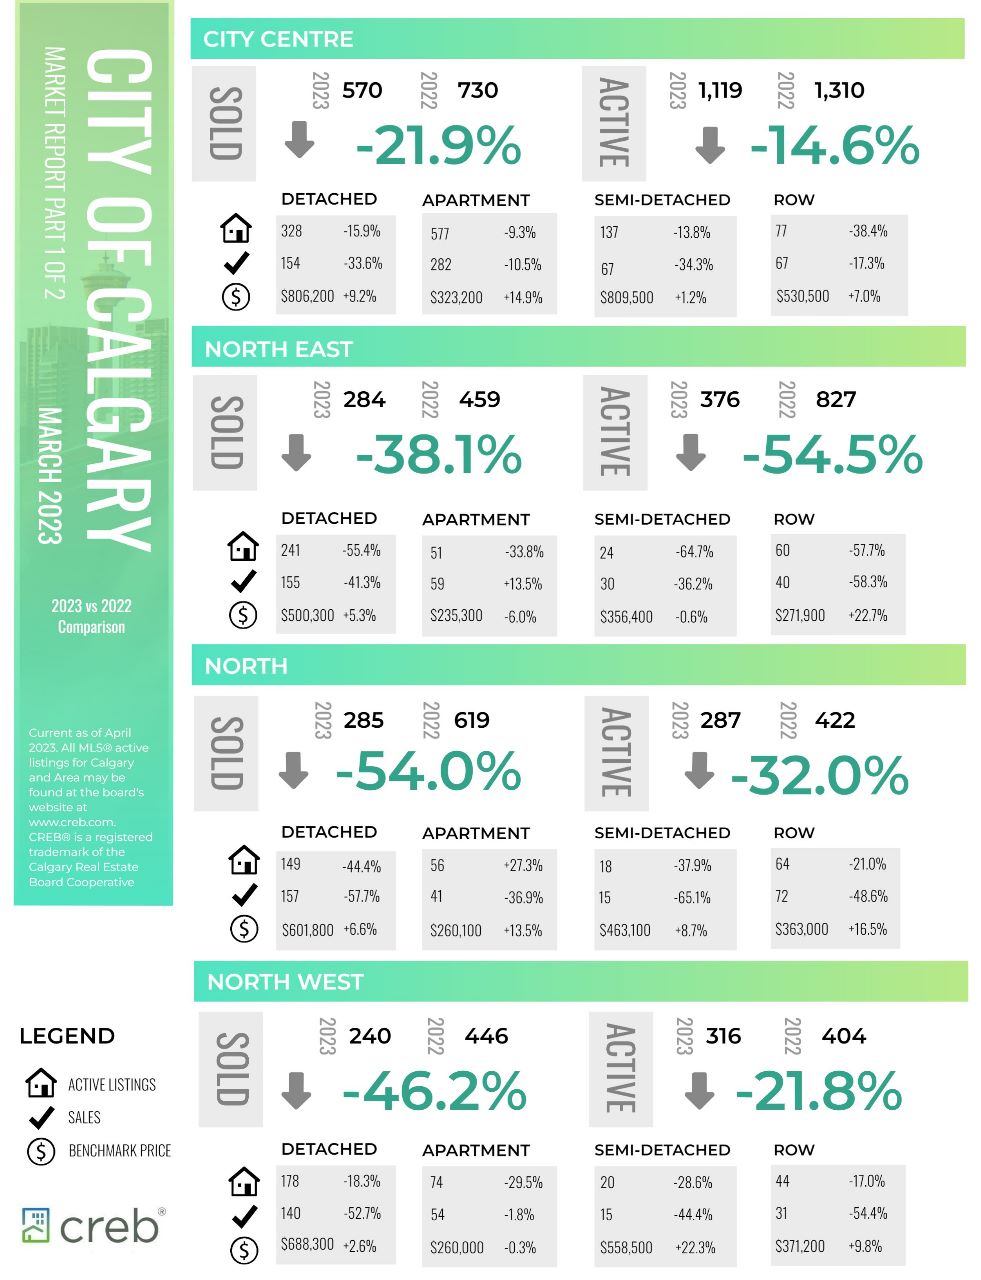
The following data is a comparison between March 2023 and March 2022 numbers, and is current as of April 2023. For last month’s numbers, check out our previous infographic.
Or follow this link for all our CREB Infographics!
Click on the images for a larger view!
Download Printable Version – March 2023 CREB, City of Calgary Report Part 1
Download Printable Version – March 2023 CREB, City of Calgary Report Part 2
Download Printable Version – March 2023 CREB, Calgary Region Report


